USGS Water Hardness Scale: The Four Classes Explained
The USGS water hardness scale: soft 0–60 mg/L, moderately hard 61–120, hard 121–180, very hard above 180. Where it comes from and how other scales differ.
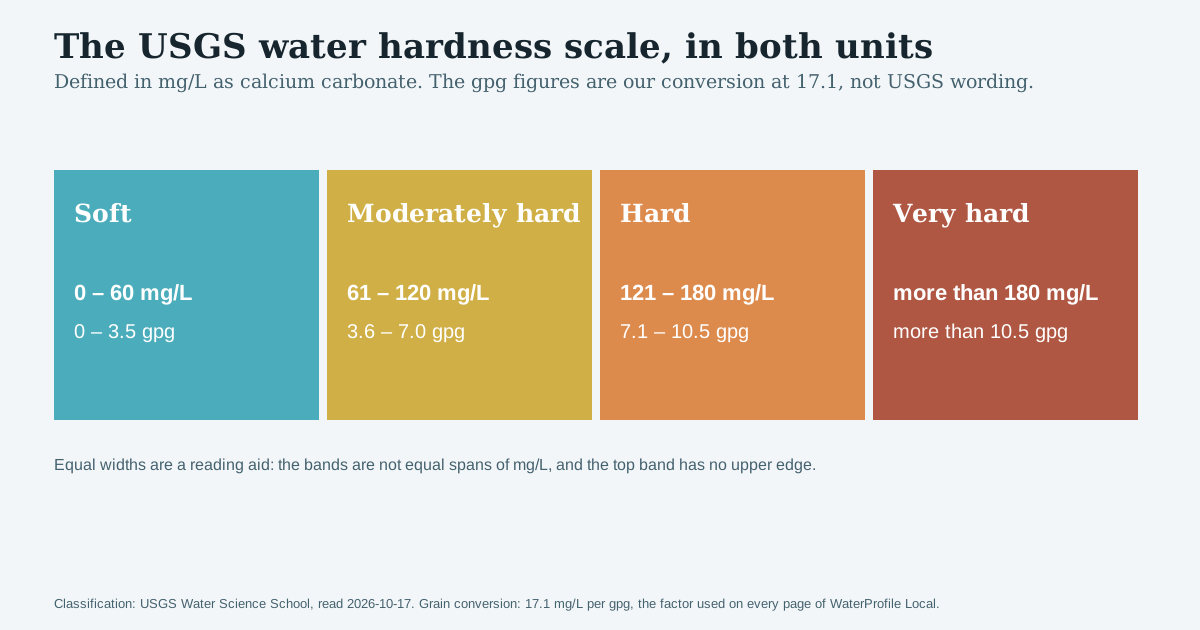
The USGS water hardness scale sorts water into four classes by its hardness in milligrams per litre as calcium carbonate: soft is 0 to 60 mg/L, moderately hard is 61 to 120 mg/L, hard is 121 to 180 mg/L, and very hard is more than 180 mg/L. Those are the US Geological Survey's own edges, published on its Water Science School pages, and they are the classification this site uses for every utility it plots.
The scale looks simple, and as a set of four numbers it is. The questions people actually bring to it are the harder part: what the "as calcium carbonate" means, what the classes look like in grains per gallon, why some sources show five classes or different edges, and what a class does and does not tell you about your water. This guide takes those in turn and then places ten real US systems on the scale.
The USGS water hardness scale at a glance
| Class | USGS wording (mg/L as CaCO₃) | Converted to grains per gallon | Example from this site |
|---|---|---|---|
| Soft | 0 to 60 | 0 to 3.5 | NYC DEP average, 32 mg/L |
| Moderately hard | 61 to 120 | 3.6 to 7.0 | Austin Water average, 93 ppm |
| Hard | 121 to 180 | 7.1 to 10.5 | Top of Denver's quarterly range, 124 mg/L |
| Very hard | more than 180 | more than 10.5 | LVVWD average, 280 ppm |
The grain column is a conversion at 17.1 mg/L per grain per gallon, the factor every page on this site uses. USGS does not publish grain figures for its classes, so treat that column as derived arithmetic rather than as part of the classification. The ppm to gpg guide explains where the 17.1 comes from.
What "as calcium carbonate" means
Hardness is caused by dissolved calcium and magnesium. The USGS defines it simply as "the amount of dissolved calcium and magnesium in the water", picked up as groundwater moves through soil and rock. But calcium and magnesium are two different elements with different atomic masses, so adding their concentrations directly would not give a meaningful total.
The convention is to express both as the mass of calcium carbonate that would carry the same hardness. That gives one number on one scale, which is why every class edge above is written "mg/L as calcium carbonate". A figure of 120 mg/L as CaCO₃ does not mean there are 120 milligrams of calcium carbonate in each litre. It means the calcium and magnesium together are equivalent to that much.
This is also why the scale works across very different waters. A system whose hardness is mostly calcium and one with a lot of magnesium can be compared directly, because both have been put on the same footing. Calcium vs magnesium hardness shows the conversion and rebuilds two utilities' totals from their published calcium and magnesium rows.
Reading the class edges correctly
The edges are where people trip, so they are worth spelling out.
Very hard is "more than 180", not "180 and above". A figure of exactly 180 mg/L is hard on the USGS wording. That is the top of the hard band, not the bottom of very hard.
The edges are whole numbers. USGS writes 0 to 60, then 61 to 120, then 121 to 180. A value like 60.5 sits in the gap; in practice, utilities do not publish to that precision, and the sensible reading is that anything above 60 is past soft.
Classes are not equal spans. Soft covers 60 mg/L, the middle two classes cover 60 each, and very hard has no upper edge at all. Ordinary US municipal water runs well past 180: the top of Indianapolis's published system-wide range is 460 ppm. Charts that draw the classes as equal widths, including the scale on this site, do so as a reading aid, and the axis is not linear in mg/L. The methodology page explains that choice.
A range can span classes. If a utility publishes 172 to 302 ppm, as Phoenix does, that range starts in hard and ends in very hard. Naming one class for it hides half the information.
Ten US systems on the USGS scale
These are the published figures for the ten water systems on this site, each read from the utility's own report or official page, classified on the USGS scale. The "plotted value" is the published average where one exists and the midpoint of the published range where it does not, which the main hardness hub labels for each system.
| System | Published figure | Plotted value (mg/L) | USGS class of plotted value | Classes the published range covers |
|---|---|---|---|---|
| Portland, Bull Run | 7 to 11 ppm | 9 (midpoint) | Soft | Soft only |
| MWRA, Boston | about 16 mg/L | 16 | Soft | Single value |
| Manchester, NH | 17.88 ppm average, 16.7 to 18.8 | 17.88 | Soft | Soft only |
| NYC DEP | 32 mg/L average, 18 to 100 | 32 | Soft | Soft to moderately hard |
| Austin Water | 93 ppm average, 70 to 126 | 93 | Moderately hard | Moderately hard to hard |
| Denver Water | 105,009 ppb average, 55,000 to 124,000 ppb | 105.0 | Moderately hard | Soft to hard |
| Phoenix | 172 to 302 ppm | 237 (midpoint) | Very hard | Hard to very hard |
| LVVWD, Las Vegas | 280 ppm average | 280 | Very hard | Single value |
| SAWS, San Antonio | 15 to 20 gpg | 299.3 (midpoint, converted) | Very hard | Very hard only |
| Indianapolis | 317 ppm average, 148 to 460 | 317 | Very hard | Hard to very hard |
Four systems are soft, two moderately hard, and four very hard on their plotted value. No system's plotted value lands in the hard class, though the published ranges of four systems — Austin, Denver, Phoenix and Indianapolis — reach into it. That gap in the middle is a feature of these ten systems, not of US water in general, and it is a reminder that ten systems are a sample, not a map.
The last column is the one to look at. Denver's quarterly figures alone cross three classes in a single year, from 55 mg/L (soft) to 124 mg/L (hard). A class name attached to an annual average of 105 hides that completely.
Putting three differently published figures on the scale
Utilities publish hardness in at least four units, and each one needs a different step before it can be placed on the USGS scale. Three of the systems above show the full set of moves.
A ppm figure: Austin. Austin Water publishes 70 to 126 ppm, average 93. Parts per million and milligrams per litre are the same number for drinking water, so no conversion is needed. The average, 93, is between 61 and 120: moderately hard. The bottom of the range, 70, is also moderately hard. The top, 126, is above 120: hard. So Austin is moderately hard on average, with part of its published range in the hard class.
A grains figure: San Antonio. SAWS publishes only grains per gallon, 15 to 20 gpg typical. Multiply by 17.1 to get mg/L: 256.5 to 342 mg/L. Both ends are above 180, so the whole published range is very hard. The midpoint, 17.5 gpg or 299.3 mg/L, is what this site plots, and it is labelled as a midpoint because SAWS publishes no average.
A parts-per-billion figure: Denver. Denver Water publishes 105,009 ppb average, range 55,000 to 124,000 ppb. Divide by 1,000 to get mg/L: 105.009, with a range of 55 to 124. The average is moderately hard; the range runs from soft to hard. Skip the division and the average looks like 105,009 mg/L, which is off the top of any scale by a factor of several hundred. If a hardness figure seems absurdly large, check whether the unit column says ppb before anything else.
The hardness converter does all three conversions and prints the USGS class next to the result, so you can check your own arithmetic against it.
Other hardness scales you will meet
The USGS scale is one convention, widely used in the US, but not the only one. Three others commonly appear alongside it.
| Source | Soft | Next class | Moderately hard | Hard | Very hard |
|---|---|---|---|---|---|
| USGS | 0–60 mg/L | — | 61–120 | 121–180 | more than 180 |
| Penn State Extension | less than 17 mg/L (1 gpg) | Slightly hard, 17–60 | 60–120 | 120–180 | more than 180 |
| Nebraska Extension | 0–17.1 mg/L (0–1 gpg) | Slightly hard, 17.1–60 | 60–120 | 120–180 | 180 and over |
| NYC DEP report footnote | up to 3 gpg (about 51 mg/L) | — | 3–9 gpg (about 51–154 mg/L) | — | — |
The two extension services split the USGS soft class in two at about one grain per gallon and call the upper part "slightly hard". Above 60 mg/L their edges agree with USGS, give or take whether a boundary value belongs to the class above or below. So a figure of 40 mg/L is soft on the USGS scale and slightly hard on the extension scales, and both statements are correct on their own terms.
New York City's report uses its own footnote in grains: up to 3 grains per gallon soft, 3 to 9 moderately hard. Converted, its moderately hard band runs to about 154 mg/L, well into what USGS calls hard. That is not a disagreement about the water; it is a different set of edges. Where the two differ, this site shows the USGS class and says so on the NYC page.
Appliance manufacturers use their own bands too. Bosch's dishwasher settings run H:00 to H:07 in millimoles per litre, with H:00 covering everything up to about 110 mg/L. Those are settings, not a classification, and the Bosch setting guide maps them to US units.
The practical rule that follows: always quote the number with the class. "Moderately hard (93 ppm)" survives a change of scale; "moderately hard" alone does not.
What a class tells you, and what it does not
It tells you roughly what to expect from scale and soap. The USGS says hard water can cause scale in equipment and makes soap and detergents less effective, and that utilities generally aim to avoid the very hard category. Penn State Extension says levels below about 7 grains per gallon, the top of the USGS moderately hard class, will probably not cause major scaling and soap film. So the move from moderately hard into hard is where the practical effects described in hard water and water heaters start to matter.
It does not tell you anything about safety. The USGS notes that EPA sets no legal limit for hardness because calcium and magnesium are not toxic. Nebraska Extension states that hard water is not a health hazard. A very hard class is not a warning.
It does not describe your tap. A class attached to a utility figure describes that utility's system over its sampling period. Your service line, your building and any treatment you already have all sit downstream. For a decision that depends on the exact figure, such as sizing a softener, a test at your own tap is the input; what size water softener do I need shows how much the answer moves across a published range.
It does not tell you what is regionally typical. The USGS map of hardness in the United States shows mean hardness at river monitoring sites in the 1975 water year. It is useful for the broad pattern and the USGS itself says regional maps are not meant for individual homes. For a figure for your water, the USGS points you to your local utility or health agency.
Using the scale with your own report
- Find the hardness line. It is usually in a secondary or aesthetic table, or on the utility's water-quality page; how to read a water quality report shows where to look.
- Read the unit first. ppm and mg/L are the same number. ppb must be divided by 1,000. Grains per gallon must be multiplied by 17.1.
- Classify each end of the range, not just the average. If the ends fall in different classes, say so.
- Check which scale any class wording in the report uses. If it is not USGS, the edges may differ.
- Use the converter if you need the figure in another unit; it prints the USGS class alongside the result.
Sources and further reading
The classification: USGS, Do you have information about water hardness in the United States? and USGS Water Science School, Hardness of Water. The 1975 map: USGS, Map of water hardness in the United States. Five-class scales: Penn State Extension, Water Softening, and Nebraska Extension, Hard Water (Calcium and Magnesium), G1274. All read 17 October 2026. Utility figures and the NYC footnote come from each utility's own report, cited with retrieval dates on its page here.
The USGS water hardness scale is four classes in mg/L as calcium carbonate — 60, 120 and 180 are the edges to remember — and it is most useful when the number travels with the class name.
Frequently asked questions
What is the USGS water hardness scale?
It is the four-class classification the US Geological Survey publishes, in milligrams per litre as calcium carbonate: soft is 0 to 60 mg/L, moderately hard is 61 to 120, hard is 121 to 180, and very hard is more than 180.
What is the USGS water hardness scale in grains per gallon?
USGS defines the classes in mg/L, not grains. Converted at 17.1 mg/L per grain, they are about 0 to 3.5 gpg soft, 3.6 to 7.0 moderately hard, 7.1 to 10.5 hard, and more than 10.5 very hard. Treat the grain figures as a conversion rather than as USGS wording.
Is 120 mg/L hard water?
On the USGS scale, 120 mg/L is the top of the moderately hard class. Hard starts at 121 mg/L. Austin Water's published average of 93 ppm is moderately hard; the top of its published range, 126 ppm, is hard.
Why do some sources list five classes, including slightly hard?
Because they use a different scale. Penn State Extension and Nebraska Extension both split the USGS soft band into soft (below about 17 mg/L, or 1 gpg) and slightly hard (about 17 to 60 mg/L). Above 60 mg/L the edges line up with the USGS classes. Neither is wrong; they are different conventions.
Does the USGS scale say whether water is safe?
No. It describes mineral content, not safety. The USGS states that the EPA sets no legal standard for hardness because calcium and magnesium are not toxic, and Nebraska Extension states that hard water is not a health hazard. The classes matter for scale, soap and appliance settings.
Where do I find my water's number to compare with the scale?
In your utility's annual water quality report, usually in a secondary or aesthetic parameters table, or on its water-quality web page. Read the unit before the value: Denver Water publishes hardness in parts per billion, so its 105,009 is 105.009 mg/L, which is moderately hard.